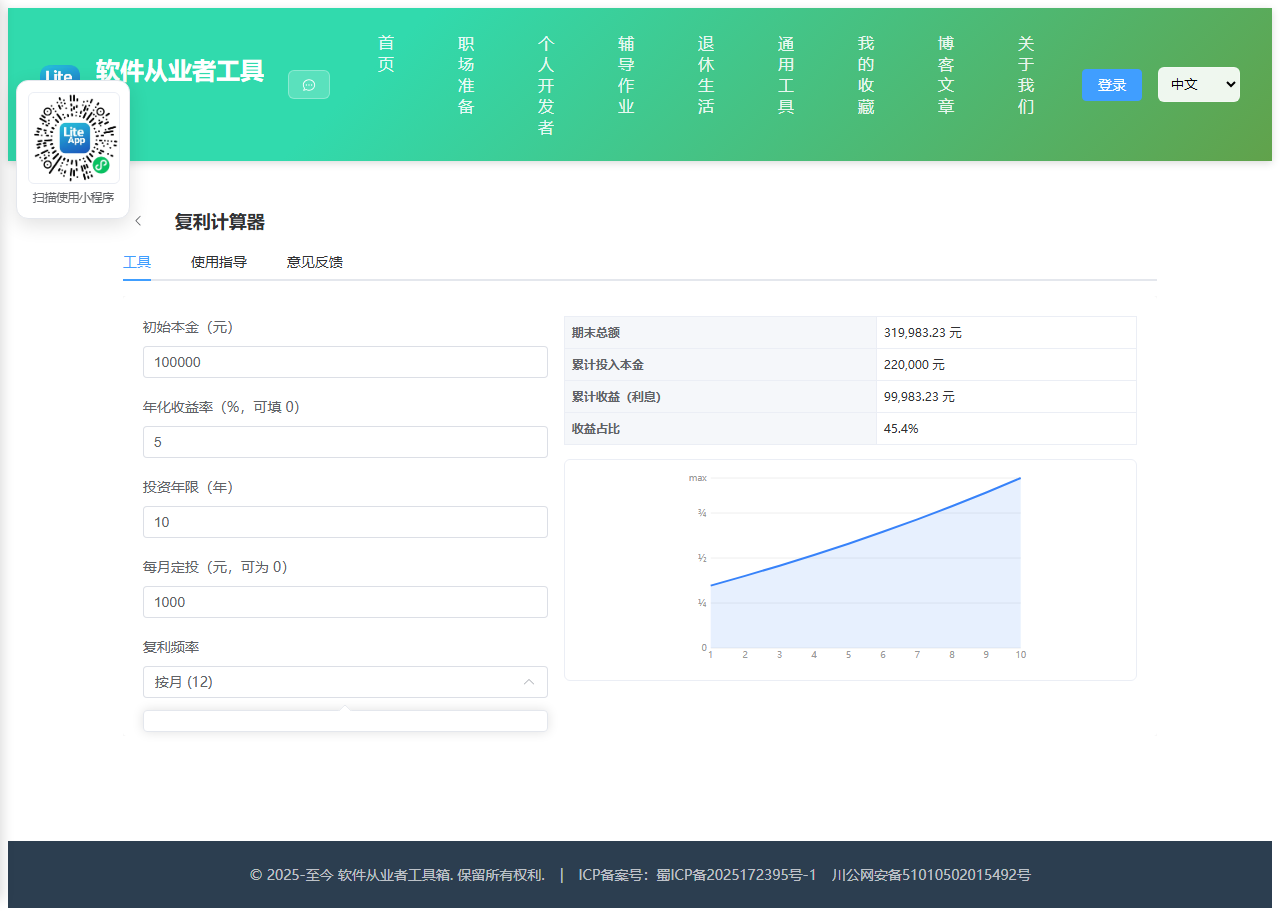
Appearance
实现 复利计算器 工具
分类:general | 标签:复利、理财、定投、计算 本金复利增长测算,支持每月定投与增长曲线
2.1 功能说明
本金复利增长测算,支持每月定投与增长曲线
2.1.1 使用指南
使用指导
计算本金在复利下的增长,可叠加每月定投。适用于教育金、养老金、长期理财规划。
参数说明
· 年化收益率支持 0(即不增值);复利频率越高,等效收益略高。
· 每月定投:在复利基础上每期追加投入。
2.2 代码实现
2.2.1 组件结构
本工具是一个基于 Vue 3 <script setup> 语法的单文件组件(SFC),统一包裹在 ToolPageShell 组件内,由它提供页面标题、工具 ID、分类与「使用指南」插槽等通用外壳;核心业务逻辑(响应式状态、计算属性、事件处理函数)全部写在 <script setup> 中,输入/输出通过 el-input、el-button 等 Element Plus 组件与用户交互,所有数据均在浏览器本地处理,不会上传服务器。
2.2.2 核心逻辑概览
<script setup> 中定义的主要函数/方法:
num()calc()maxVal()computedPts()computedArea()computedLabels()fmt()
2.2.3 关键实现代码
以下是该工具的完整 <script setup> 实现(核心代码)。模板(<template>)与样式(<style>)已省略。
vue
import { ref, reactive, computed } from 'vue'
import ToolPageShell from '@/components/ToolPageShell.vue'

const principal = ref('100000')
const rate = ref('5')
const years = ref('10')
const monthly = ref('1000')
const freq = ref(12)
const err = ref('')

const result = reactive({ final: 0, totalPrincipal: 0, interest: 0, interestPct: 0, series: [] })

function num(v) {
  const n = parseFloat(v)
  if (isNaN(n)) return null
  return n
}

function calc() {
  err.value = ''
  result.series = []
  const P = num(principal.value)
  const r = num(rate.value)
  const n = num(years.value)
  const m = num(monthly.value)
  if (P === null || P < 0) { err.value = '初始本金必须是非负数字'; return }
  if (r === null || r < 0) { err.value = '年化收益率必须是非负数字'; return }
  if (n === null || n <= 0 || !Number.isInteger(n)) { err.value = '投资年限必须是正整数'; return }
  if (m === null || m < 0) { err.value = '每月定投必须是非负数字'; return }

  const periods = freq.value * n
  const i = r / 100 / freq.value
  const perContribution = m * (freq.value / 12)
  let balance = P
  let contributed = P
  const yearly = []
  for (let p = 1; p <= periods; p++) {
    balance = balance * (1 + i) + perContribution
    contributed += perContribution
    if (p % freq.value === 0) yearly.push(balance)
  }
  result.final = balance
  result.totalPrincipal = contributed
  result.interest = balance - contributed
  result.interestPct = contributed > 0 ? ((balance - contributed) / contributed * 100).toFixed(1) : '0.0'
  result.series = yearly
}

const gridY = [
  { y: 180, label: '0' },
  { y: 135, label: '¼' },
  { y: 90, label: '½' },
  { y: 45, label: '¾' },
  { y: 10, label: 'max' }
]
const linePoints = computedPts()
const areaPoints = computedArea()
const pointLabels = computedLabels()

function maxVal() {
  const s = result.series
  return s.length ? Math.max(...s) : 1
}
function computedPts() {
  return computed(() => {
    const s = result.series
    const max = maxVal()
    const len = s.length || 1
    return s.map((v, idx) => {
      const x = 40 + (idx / (len - 1 || 1)) * 310
      const y = 10 + (1 - v / max) * 170
      return `${x.toFixed(1)},${y.toFixed(1)}`
    }).join(' ')
  })
}
function computedArea() {
  return computed(() => {
    const s = result.series
    const max = maxVal()
    const len = s.length || 1
    const pts = s.map((v, idx) => {
      const x = 40 + (idx / (len - 1 || 1)) * 310
      const y = 10 + (1 - v / max) * 170
      return `${x.toFixed(1)},${y.toFixed(1)}`
    })
    return `40,180 ${pts.join(' ')} 350,180`
  })
}
function computedLabels() {
  return computed(() => {
    const s = result.series
    const len = s.length || 1
    return s.map((v, idx) => ({
      x: 40 + (idx / (len - 1 || 1)) * 310,
      t: idx + 1
    }))
  })
}

function fmt(n) {
  return (n || 0).toLocaleString('zh-CN', { maximumFractionDigits: 2 })
}

calc()
2.3 效果截图